Examples
import beautifulplots as bp
import pandas as pd
Barplot
# Data and Dataframe
print('Data:Product Category Sales by Store')
barplot_data = { 'category':['groceries','groceries','groceries', 'hardware','hardware','hardware','hobbies','hobbies','hobbies'] ,
'sales':[ 900, 600,500, 500,300,200,400,400,200], 'store':['Store-A','Store-B','Store-C','Store-A','Store-B','Store-C','Store-A','Store-B','Store-C'] }
df = pd.DataFrame(barplot_data)
# unit sales by category ... assume some average sale price per category
def unit_sales(row):
units = 0
if row['category'] == 'groceries': units = row['sales']/5
elif row['category'] == 'hardware': units = row['sales']/10
elif row['category'] == 'hobbies': units = row['sales']/20
return units
df['units']= df.apply(lambda row: unit_sales(row),axis=1)
display(df)
# Plots
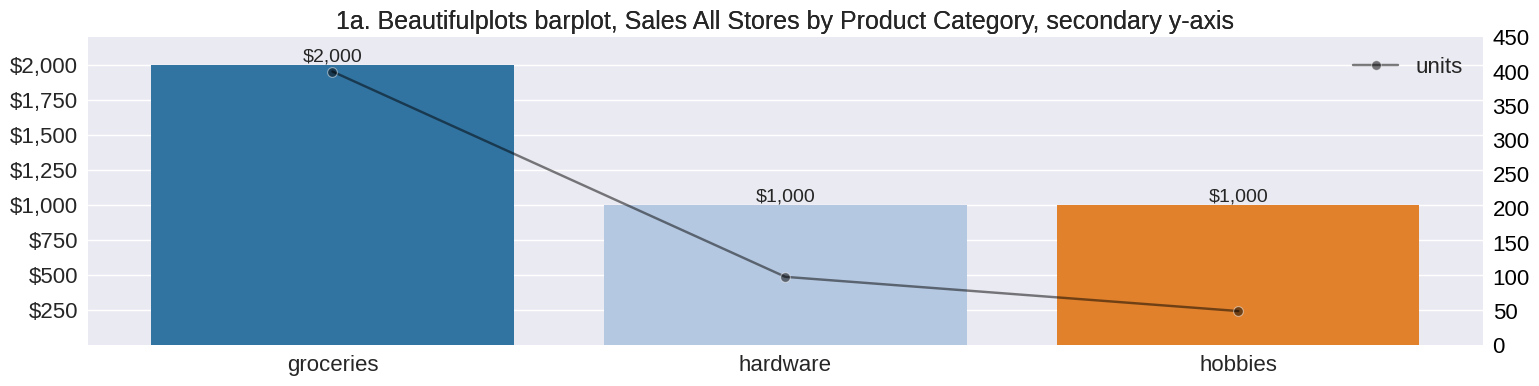
# Example 1a
bp.barplot(df,'category','sales', palette='tab20',
title='1a. Beautifulplots barplot, Sales All Stores by Product Category, secondary y-axis', figsize=(18,4),
bardatalabels=True, bardataformat=",.0f", barcurrency="$", y_lims = (0.1,2200), estimator2=sum,
y2='units',y_lims2=(0,450),y2_axis_label='units', color2='black',marker2="o", y2_axis_format=".0f")
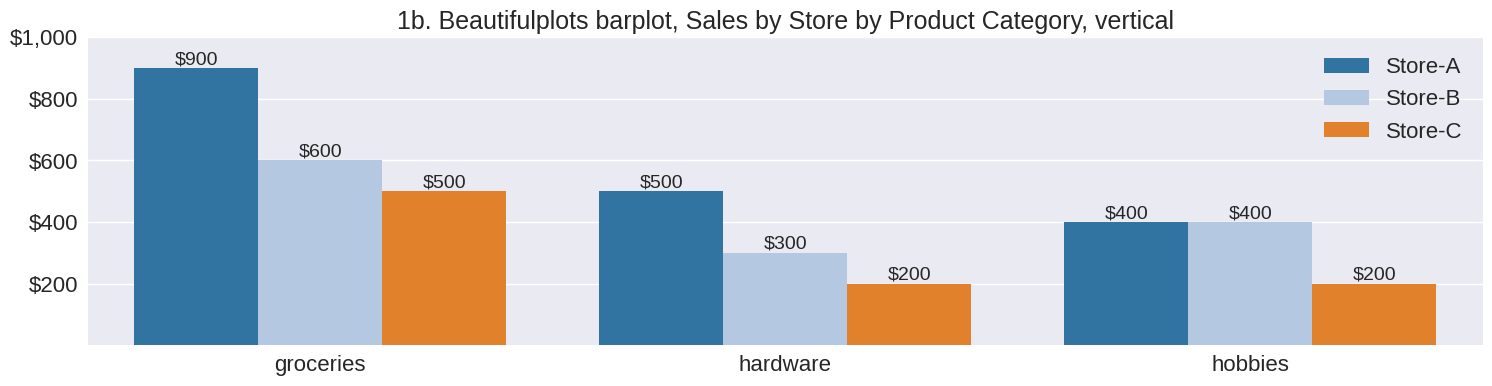
# Example 1b
bp.barplot(df,'category','sales',hue='store', palette='tab20',
title='1b. Beautifulplots barplot, Sales by Store by Product Category, vertical', figsize=(18,4),
bardatalabels=True, barcurrency="$", bardataformat=",.0f",
y_lims = (0.1,1000))
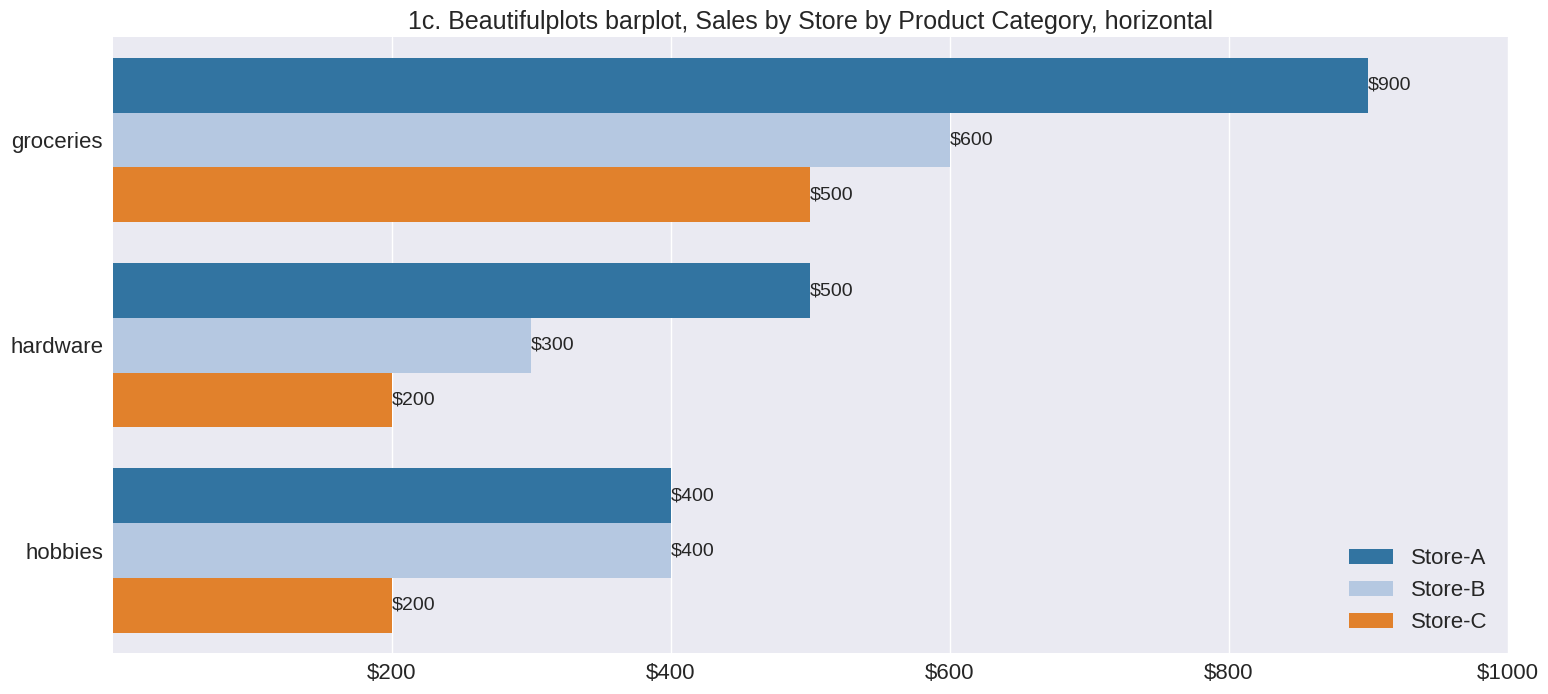
# Example 1c
bp.barplot(df,'category','sales',hue='store', palette='tab20',
title='1c. Beautifulplots barplot, Sales by Store by Product Category, horizontal', figsize=(18,8),
bardatalabels=True, bardataformat=".0f", barcurrency="$", barorientation='h',
x_lims = (0.1,1000), legend_loc="lower right")
Data:Product Category Sales by Store
| category | sales | store | units | |
|---|---|---|---|---|
| 0 | groceries | 900 | Store-A | 180.0 |
| 1 | groceries | 600 | Store-B | 120.0 |
| 2 | groceries | 500 | Store-C | 100.0 |
| 3 | hardware | 500 | Store-A | 50.0 |
| 4 | hardware | 300 | Store-B | 30.0 |
| 5 | hardware | 200 | Store-C | 20.0 |
| 6 | hobbies | 400 | Store-A | 20.0 |
| 7 | hobbies | 400 | Store-B | 20.0 |
| 8 | hobbies | 200 | Store-C | 10.0 |
Lineplot
import datetime as dt

# Data - S&P 500
sp500_file =  '../data/GSPC_1950-1-3_to_2022-6-8.csv'
df_sp500 = pd.read_csv(sp500_file,index_col=0,parse_dates=True)
df = df_sp500.reset_index() # reset index ...  Seaborn and thus beautifulpltos requires x-axis to be a column
display(df.head())


# bp lineplot
bp.lineplot(df,x='Date' , y=['Close','Open'], y2='Volume',y_axis_format=".0f",y_currency="$", y2_axis_format=",.0f",
             y_lims=(0,4000), y_lims2=(0,10*1e9), legend_loc2 = "lower left", color2='red',
             figsize=[12,4], legend=True, y_axis_label = "price", y2_axis_label="volume", x_label="date",
             title="Beautifulplots lineplot w secondary Y-axis, S&P 500")
| Date | Close | High | Low | Open | Volume | Adj Close | |
|---|---|---|---|---|---|---|---|
| 0 | 1950-01-03 | 16.66 | 16.66 | 16.66 | 16.66 | 1260000.0 | NaN |
| 1 | 1950-01-04 | 16.85 | 16.85 | 16.85 | 16.85 | 1890000.0 | NaN |
| 2 | 1950-01-05 | 16.93 | 16.93 | 16.93 | 16.93 | 2550000.0 | NaN |
| 3 | 1950-01-06 | 16.98 | 16.98 | 16.98 | 16.98 | 2010000.0 | NaN |
| 4 | 1950-01-09 | 17.08 | 17.08 | 17.08 | 17.08 | 2520000.0 | NaN |

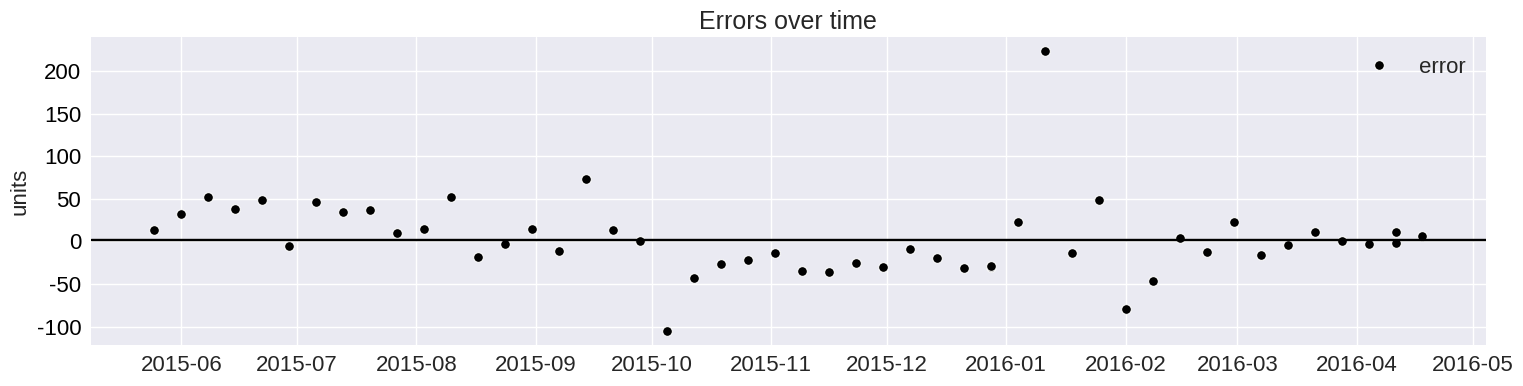
Forecast Confidence and Errors
file =  '../data/m5_forecast_results_FOODS_3_030_TX_3_ci90_npred50.csv'
df = pd.read_csv(file, parse_dates = ["yearweek_dt"])
error_avg = df["error"].mean()
print(f'error_avg = {error_avg:1.2f}')

display(df.tail())

bp.lineplot(df, x= "yearweek_dt", y=["unit_sales_train", "unit_sales_test", "unit_sales_pred"],
            y_axis_label = "units", y_axis_format=".0f", yfb=("units_pred_lower","units_pred_upper"),
            yfb_color="blue", title="M5 Forecast, Observations and Forecast w 90% CI and 50 Predictions",
            figsize= (18,6))


bp.lineplot(df.tail(50), x="yearweek_dt", y=["unit_sales_test","unit_sales_pred"],
            y_axis_label = "units", y_axis_format=".0f",
            title = 'Truth ("test") and Forecast ("pred")',
            figsize=(18,4))


bp.lineplot(df.tail(50), x="yearweek_dt", y="error",  h_line = [error_avg, 2],
            y_axis_label = "units", y_axis_format=".0f",linestyle="None", marker="o", color="k",
            title = "Errors over time",
            figsize=(18,4))
error_avg = 3.22
| yearweek_dt | item_id | store_id | unit_sales_train | unit_sales_test | unit_sales | unit_sales_pred | error | error_lower | error_upper | units_pred_lower | units_pred_upper | |
|---|---|---|---|---|---|---|---|---|---|---|---|---|
| 276 | 2016-03-28 | FOODS_3_030 | TX_3 | NaN | 141.0 | 141 | 140.420405 | 0.579595 | -44.792355 | 52.277192 | 95.628049 | 192.697596 |
| 277 | 2016-04-04 | FOODS_3_030 | TX_3 | NaN | 131.0 | 131 | 134.073590 | -3.073590 | -44.792355 | 52.277192 | 89.281234 | 186.350781 |
| 278 | 2016-04-11 | FOODS_3_030 | TX_3 | NaN | 128.0 | 128 | 130.374611 | -2.374611 | -44.792355 | 52.277192 | 85.582255 | 182.651802 |
| 279 | 2016-04-11 | FOODS_3_030 | TX_3 | NaN | 128.0 | 128 | 116.867647 | 11.132353 | -44.792355 | 52.277192 | 72.075291 | 169.144838 |
| 280 | 2016-04-18 | FOODS_3_030 | TX_3 | NaN | 137.0 | 137 | 130.340391 | 6.659609 | -44.792355 | 52.277192 | 85.548036 | 182.617583 |


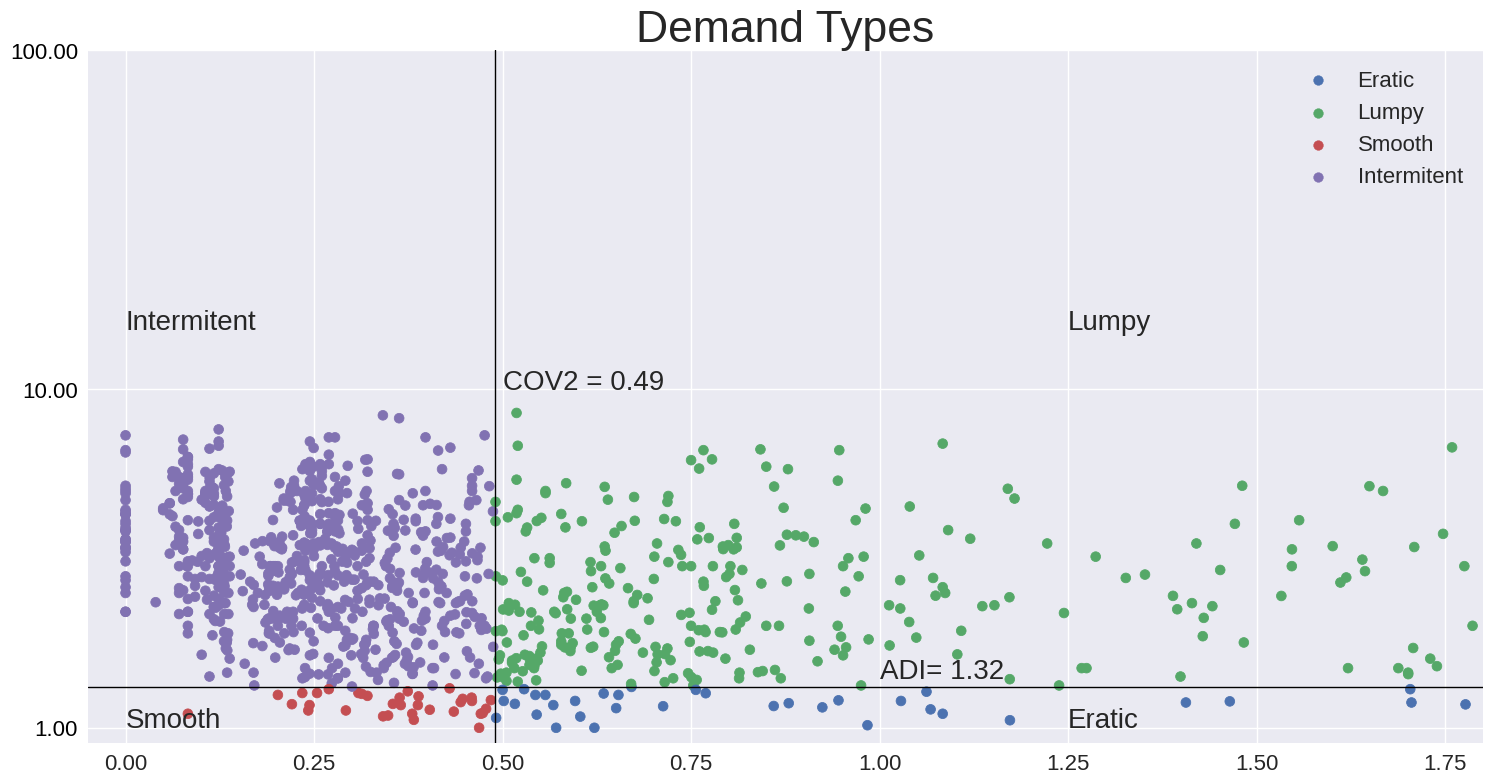
Scatter Plot
# Data ... Olist Ecommerce Demand Type


file =  '../data/olist_orders_demand_type_minnzp10_20220817.csv'
df = pd.read_csv(file,index_col=0)

display(df.head())


bp.scatterplot(df, 'COV2', 'ADI' , h_line=1.32, v_line=0.49,  y_scale="log" , hue='type', figsize=(18,9),
      annotate = [ ('ADI= 1.32', (1, 1.4) ),
                                       ('COV2 = 0.49' ,(0.5 ,10)),
                                       ('Smooth',(0,1)),
                                       ('Intermitent',(0,15)),
                                       ('Lumpy',(1.25,15)),
                                       ('Eratic',(1.25,1))],
            annotate_fontsize = 20, title='Demand Types', title_fontsize = 32)
| seller_id | units_total | nonzero_demand_periods | n_time_periods | units_mean | units_std | COV2 | ADI | type | |
|---|---|---|---|---|---|---|---|---|---|
| product_id | |||||||||
| 422879e10f46682990de24d770e7f83d | 1f50f920176fa81dab994f9023523100 | 793.0 | 58 | 68 | 13.672414 | 18.226054 | 1.777031 | 1.172414 | Eratic |
| aca2eb7d00ea1a7b8ebd4e68314663af | 955fee9216a65b617aa5c0531780ce60 | 640.0 | 38 | 56 | 16.842105 | 13.097403 | 0.604752 | 1.473684 | Lumpy |
| 368c6c730842d78016ad823897a372db | 1f50f920176fa81dab994f9023523100 | 551.0 | 57 | 58 | 9.666667 | 9.588560 | 0.983905 | 1.017544 | Eratic |
| 53759a2ecddad2bb87a079a1f1519f73 | 1f50f920176fa81dab994f9023523100 | 545.0 | 61 | 73 | 8.934426 | 10.811828 | 1.464418 | 1.196721 | Eratic |
| 99a4788cb24856965c36a24e339b6058 | 4a3ca9315b744ce9f8e9374361493884 | 536.0 | 72 | 77 | 7.444444 | 5.218842 | 0.491455 | 1.069444 | Eratic |
help
Issuing help on each of the funtions lists documentation on the how the function operates and its inputs and outputs.
help plot_defaults
help(bp.plot_defaults)
Help on function plot_defaults in module beautifulplots.beautifulplots:

plot_defaults()
    Dictionary of plot parameters. Each parameter coresponds and corresponding value.
    See also get_plot_options for extracting plot options from **kwargs.

    **Axis - x, y, and plot area parameters**

    Args:
        df (DataFrame): The input DataFrame containing colums corresponding to bar values and columns.

        title (String): corresponds to the axis title. default = ''

        title_fontsize: font size of the axis title, default = 18

        x_lims: (xmin, xmax), minimum and maximum x-values of the axis. default = None, in which case the min and max are set automatically by matplotlib.

        y_lims: (ymin,ymax), minimum and maximum y-values of the axis. default = None, in which case the min and max are set automatically by matplotlib.

        y2_lims: (ymin,ymax), minimum and maximum y-values of the secondary axis. default = None, in which case the min and max are set automatically by matplotlib.

        x_label_fontsize: default = 16

        x_tick_labelsize: default = 16

        x_tick_fontsize: default = 16

        x_tick_rotation: default = 0

        y_label_fontsize: ylabel font size, default = 16

        y_tick_fontsize: xtick label font size, default = 16

        y_tick_rotation:  Rotation of the xtick label, default = 0


    **Plot attributes - Line, Bar, Scatter Plots**

    Args:

        marker: Matplotlib line markers. default = None (Matplotlib default).

        marker2: Secondary axis, Matplotlib line marker. default = None (Matplotlib default).

        marker: sns line markers. default = None (sns default).

        marker2: Secondary axis, sns line markers. default = None (sns default).

        y_axis_currency (Boolean): Boolean default = False.

        y_tick_format (String): String default = None (Matplotlib default).

        alpha (fraction): Trasnparancy (opacity), default = None (not transparent)

        alpha2 (fraction): Secondary axis, default = 0.5, 50% opacity

        legend_labels (list): Overide default legend labels. default = None (do not override)

        legend_loc(String): Matplotlib legend location, for example, upper right , default = "best".

        legend_loc2 (String): Secondary axis legend location, for example, upper right , default = best.

        legend_fontsize: legend font size, default = 16

        estimator: seaborn barplot summary estimator, default = sum

        estimator2: secondary axis, seaborn barplot summary estimator, default = sum

        color: default = None, indicateing Matplolib default (Matplotlib default)

        color2: secondary axis line, bar or color. defualt = None (Matplotlib default)

        palette: colormap, default = None

        palette2: colormap, default = None, secondary y axis.

        hue: dimension value for corresponding Seaborn graphs, default = None.

        errorbar: Seaborn errorbar parameter: float, sd, or None

        errorbar2: Seaborn errorbar parameter second y axis: float, sd, or None

        x_label (String): xlabel title, default = ''

        y_label (String):  y lable title, default = ''

        h_line (int):  y-value, corresponding to horizontal line, default = None

        h_line_label (String):  y value, corresponding to horizontal line, default = None

        v_line (int):  x-value, corresponding to vertical line, default = None (no line)

        v_line_label (String):  x value, corresponding to vertical line, default = None (no line)

        y_scale (String): scale for the y-axis (e.g., yscale = "log"), default = None (default is linear)

        x_scale (String): scale for the x-axis (e.g., xscale = "log"), default = None (default is linear)

    **Plots and subplots**

    Parameters corresponding to the plot or subplot characteristics. They are used when matplot_helpers
    functions create the plot figure and axis, otherewise, these parameters do not affect the plot.

    Args:

        plot_style (String): matplotlib plot style

        fig_size: total size (height, width) in inches of the figure, including total plotting area of all subplots and spacing

        w_space: width space (horizontal) between subplots, default wspace = 0.2

        h_space: height space (vertical) between subplots, default hspace = 0.2

    **Annotations**

    Args:
        annotate (List of Strings and positions): default = None.  List of Strings with corresponding (x,y) positions.

        annotate_fontsize (int): default = 16. Fontsize for each annotation.

    **Returns**

        Dictionary: {parameter1:value1, parameter2:value2, ... }.
        Pairs of plat parameters and corresponding values.
help barplot
help(bp.barplot)
Help on function barplot in module beautifulplots.barplot:

barplot(df, bar_columns, bar_values, barcurrency=None, barorientation='v', bardataformat='1.2f', y2=None, estimator=<built-in function sum>, estimator2=<built-in function sum>, ax=None, bardatalabels=False, test_mode=False, bardatafontsize=14, **kwargs)
    Bar plot function designed for ease of use and aesthetics.
    The underlying barplot is ased on the Seaborn with additions, such as secondary axis, data labels,
    and improved default parameters. Refer to beautifulplots plot_defaults for a complete list of options.

    Args:
        df (DataFrame): The input DataFrame containing colums corresponding to bar_plot values ("bar_values") and column names (see examples in documentation)

        bar_columns: Datafrae columns corresponding to bar column names

        bar_values: Dataframe column corresponding to bar column values

        ax (axis): matplotlib axis (optional), default = None. If axis is None, then create a matplolib figure, axis to host the barplot

        color: Matplotlib compatabile color name as text or RGB values, for example,  color = [51/235,125/235,183/235].

        palette: Matplotlib compatible color palette name, for example, "tab20"

        hue: Name of hue dimension variable (i.e., DataFrame column name)

        ci: Seaborn confidence interval parameter: float, sd, or None, default = None

        barorientation: default = v (vertical), or h (horizontal)

        barcurrency: default = False (bar values do not represent currency). True (bar values represent currency, append $ to the value)

        bardatalabels (Boolean): default = False (data labels not included)

        estimater: default = sum. Specifies how to aggregate plot bar data.

        estimator2: default = None. Summarize y2 asis daa. Default is no aggregation, do not summarize y2 axis data.

        additional options:  see beautifulplot.plot_defaults for additional input variables.


    Returns:
        returns True if processing completes succesfully (without errors).
help lineplot
help(bp.lineplot)
Help on function lineplot in module beautifulplots.lineplot:

lineplot(df, x, y, y2=None, ax=None, test_mode=False, estimator=None, estimator2=None, **kwargs)
    Lineplot function designed for ease of use and aesthetics. Based on the
    Seaborn lineplot, with additions such as secondary axis, ease of use, and
    improved default parameters. Refer to beautiful plot_defaults for full list of options.

    Args:
        df (Dataframe): The input DataFrame containing colums corresponding to x and y

        x: Dataframe column corresponding to the lineplot x-axis
            aldfsd;lfj

        y: Dolumn or list of columns corresponding to the lineplot y-axis

        y2: Column or list of columns correspondng to the secondary axis, default = None

        yaxisformat: default = "1.2f"

        ycurrency: default = None. Primary y-axis. For example = "$" to prepend dollar symbol.

        y2currency: default = None. Secondary y-axis. For example = "$" to prepend dollar symbol.

        marker: default = None. Primary y-axis. Matplotlib line marker. If y is a list, then marker must be a list of markers.

        marker2: default = None. Secondary y-axis. Matplotlib line marker. If y2 is a list, then marker2 must be a list of markers.

        estimator: Specifies how to summarize data corresponding to y-axis. Defaults to plot all data points do not summarize.

        estimator2: Specifies how to summarize data corresponding to y2-axis. Defaults to plot all data points do not summarize.

        additional options:  see beautifulplot.plot_defaults for additional input variables.

    Returns:
        returns None if processing completes succesfully (without errors).
help Scatterplot
help(bp.scatterplot)
Help on function scatterplot in module beautifulplots.scatterplot:

scatterplot(df, x, y, ax=None, test_mode=False, **kwargs)
    Scatterplot function.
    The underlying barplot is ased on the Seaborn with additions, such as data labels,
    and improved default parameters. Refer to beautifulplots plot_defaults for a complete list of options.

    Args:
        df (DataFrame): The input DataFrame containing colums corresponding to bar_plot values ("bar_values") and column names (see examples in documentation)

        x: Dataframe column corresponding to the  x-axis

        y: Column or list of columns corresponding to the y-axis

        ax (axis): matplotlib axis (optional), default = None. If axis is None, then create a matplolib figure, axis to host the barplot

        color: default = None (Matplotlib default). Matplotlib compatabile color name as text or RGB values, for example, color = [51/235,125/235,183/235].

        palette: Matplotlib compatible color palette name, for example, "tab20"

        hue: Name of hue dimension variable (i.e., DataFrame column name)

        additional options:  see beautifulplot.plot_defaults for additional input variables.

    Returns:
        returns True if processing completes succesfully (without errors).
help Beautifulplots
You may notice lots of potential input arguements in the above examples beyound the basic signature of the function. This is done by handling the additional arguments in the **kwargs parameters and passing them down into the Beautifulplots plot options dictionary. See below.
help(bp.beautifulplots)
Help on module beautifulplots.beautifulplots in beautifulplots:

NAME
    beautifulplots.beautifulplots

FUNCTIONS
    get_kwargs(**kwargs)
        process **kwargs options corresponding to the plot_defaults dictionary (see above)
        If a beautifulplots plot_option dictionary key is
        contained in the **kwargs then the plot_defautls[key] value is replaced
        with that found in **kwargs.

        Returns:
            Dictionary: {parameter1:value1, parameter2:value2, ...} dictionary corresponding to plot options

    plot_defaults()
        Dictionary of plot parameters. Each parameter coresponds and corresponding value.
        See also get_plot_options for extracting plot options from **kwargs.

        **Axis - x, y, and plot area parameters**

        Args:
            df (DataFrame): The input DataFrame containing colums corresponding to bar values and columns.

            title (String): corresponds to the axis title. default = ''

            title_fontsize: font size of the axis title, default = 18

            x_lims: (xmin, xmax), minimum and maximum x-values of the axis. default = None, in which case the min and max are set automatically by matplotlib.

            y_lims: (ymin,ymax), minimum and maximum y-values of the axis. default = None, in which case the min and max are set automatically by matplotlib.

            y2_lims: (ymin,ymax), minimum and maximum y-values of the secondary axis. default = None, in which case the min and max are set automatically by matplotlib.

            x_label_fontsize: default = 16

            x_tick_labelsize: default = 16

            x_tick_fontsize: default = 16

            x_tick_rotation: default = 0

            y_label_fontsize: ylabel font size, default = 16

            y_tick_fontsize: xtick label font size, default = 16

            y_tick_rotation:  Rotation of the xtick label, default = 0


        **Plot attributes - Line, Bar, Scatter Plots**

        Args:

            marker: Matplotlib line markers. default = None (Matplotlib default).

            marker2: Secondary axis, Matplotlib line marker. default = None (Matplotlib default).

            marker: sns line markers. default = None (sns default).

            marker2: Secondary axis, sns line markers. default = None (sns default).

            y_axis_currency (Boolean): Boolean default = False.

            y_tick_format (String): String default = None (Matplotlib default).

            alpha (fraction): Trasnparancy (opacity), default = None (not transparent)

            alpha2 (fraction): Secondary axis, default = 0.5, 50% opacity

            legend_labels (list): Overide default legend labels. default = None (do not override)

            legend_loc(String): Matplotlib legend location, for example, upper right , default = "best".

            legend_loc2 (String): Secondary axis legend location, for example, upper right , default = best.

            legend_fontsize: legend font size, default = 16

            estimator: seaborn barplot summary estimator, default = sum

            estimator2: secondary axis, seaborn barplot summary estimator, default = sum

            color: default = None, indicateing Matplolib default (Matplotlib default)

            color2: secondary axis line, bar or color. defualt = None (Matplotlib default)

            palette: colormap, default = None

            palette2: colormap, default = None, secondary y axis.

            hue: dimension value for corresponding Seaborn graphs, default = None.

            errorbar: Seaborn errorbar parameter: float, sd, or None

            errorbar2: Seaborn errorbar parameter second y axis: float, sd, or None

            x_label (String): xlabel title, default = ''

            y_label (String):  y lable title, default = ''

            h_line (int):  y-value, corresponding to horizontal line, default = None

            h_line_label (String):  y value, corresponding to horizontal line, default = None

            v_line (int):  x-value, corresponding to vertical line, default = None (no line)

            v_line_label (String):  x value, corresponding to vertical line, default = None (no line)

            y_scale (String): scale for the y-axis (e.g., yscale = "log"), default = None (default is linear)

            x_scale (String): scale for the x-axis (e.g., xscale = "log"), default = None (default is linear)

        **Plots and subplots**

        Parameters corresponding to the plot or subplot characteristics. They are used when matplot_helpers
        functions create the plot figure and axis, otherewise, these parameters do not affect the plot.

        Args:

            plot_style (String): matplotlib plot style

            fig_size: total size (height, width) in inches of the figure, including total plotting area of all subplots and spacing

            w_space: width space (horizontal) between subplots, default wspace = 0.2

            h_space: height space (vertical) between subplots, default hspace = 0.2

        **Annotations**

        Args:
            annotate (List of Strings and positions): default = None.  List of Strings with corresponding (x,y) positions.

            annotate_fontsize (int): default = 16. Fontsize for each annotation.

        **Returns**

            Dictionary: {parameter1:value1, parameter2:value2, ... }.
            Pairs of plat parameters and corresponding values.

    set_axisparams(options_dict, ax, g)
        Receives as input a dictionary of plot options and applies the options to the maxtplotlib axis and graph.

        Args:
            options_dict (dictionary): dictionar containint plot options. Each key, value pair corresponds to a plot parameter
            ax (axis): matplotlib axis to apply the plot options
            g (graph): matplotlib graph to apply the plot options

        Returns:
            None: returns None if the function completes without errors.

    set_yaxis_format(ax, yaxisformat='1.2f', ycurrency=None, labelcolor='black', which='major')

FILE
    /home/docs/checkouts/readthedocs.org/user_builds/beautifulplots/envs/latest/lib/python3.8/site-packages/beautifulplots/beautifulplots.py